Documentation
Introduction
Visualign Auditor is an automated testing and verification tool that bridges the gap between Figma design tokens and live CSS implementations. By autonomously rendering your website in a headless browser environment, it mathematically calculates design drift against your source-of-truth tokens—eliminating subjective visual QA.
Who is this for?
- Designers: Stop playing "spot the difference." Prove exactly where implementation drifts from the design system without ever having to manually inspect browser developer tools.
- Engineers: Stop guessing hex codes and pixel values. Receive actionable bug tickets that provide the exact CSS variable/token needed to fix a styling issue, rather than vague "this looks wrong" feedback.
- QA & Automation Testers: Replace tedious manual visual QA with a deterministic, math-based auditing engine that catches rogue styles instantly.
- Design System Managers: Track overall health scores, audit massive token collections across hundreds of URLs, and monitor system adoption trends over time.
- Product & Engineering Leadership: Finally quantify "design debt." Prioritize UI refactoring using hard data and trendlines instead of subjective opinions.
Getting Started
Visualign operates entirely from the outside in. It requires absolutely no installation in your local code repository—meaning no SDKs, no NPM packages, and no CI/CD pipeline modifications. You control everything directly from our Figma Plugin.
Automatic Free Trial: The very first time you launch the plugin in Figma, a 3-audit Free Token is automatically generated and securely saved to your local Figma client. You do not need to register an account or visit our website to begin testing.
- Install the Visualign Auditor plugin from the Figma Community.
- Open the plugin in a file that contains your design system variables or Tokens Studio data.
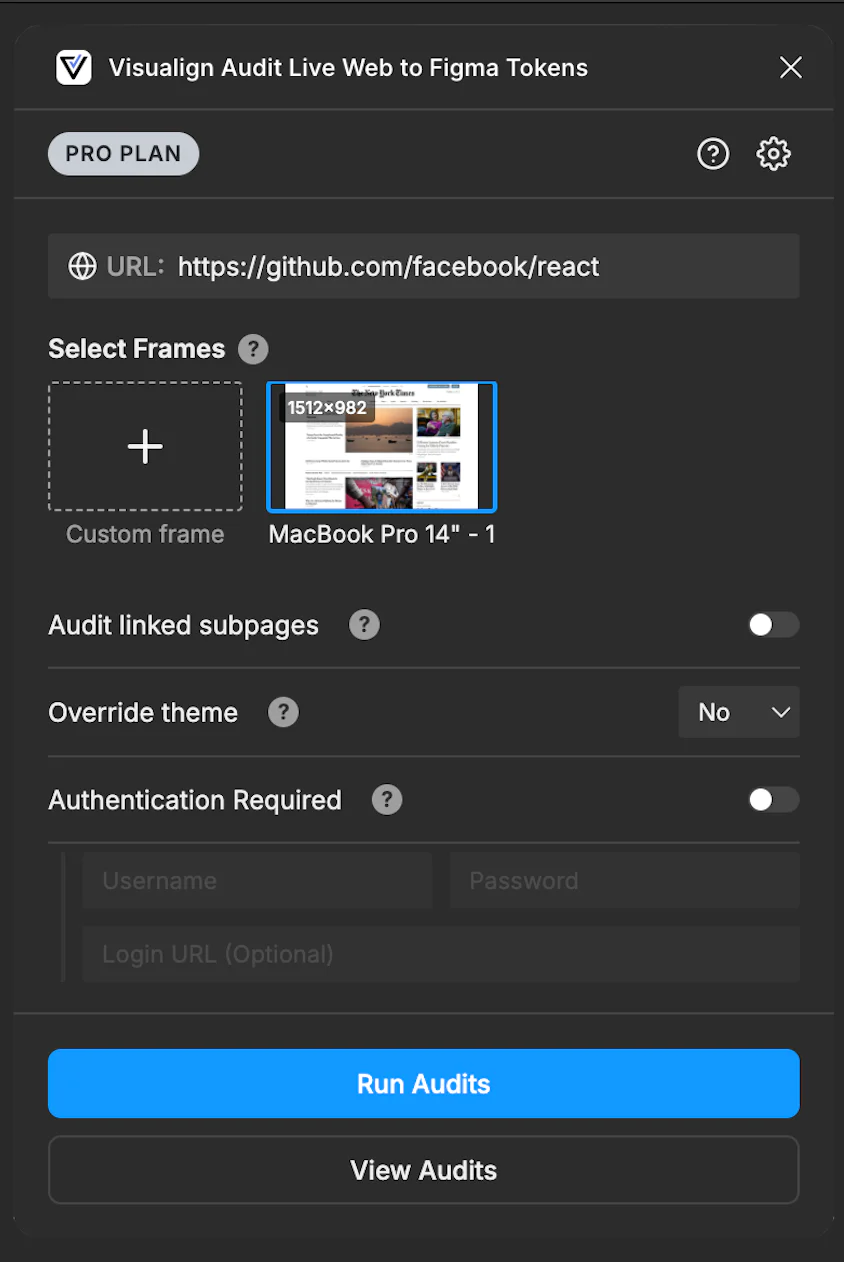
- Enter a target URL and select a Figma frame (to dictate the viewport size).
- Click Run Audits and then View Audits to launch your secure web dashboard.
Tiers & Paid Plans
You can generate as many Free Tokens as you like directly from our website's pricing page to continue casual testing. However, if you are working on a large application, you can upgrade to a Pro or Business license to unlock advanced capabilities like Authentication, Bulk Subpage Auditing, Custom Themes, and longer data retention.
The Figma Plugin
The plugin serves as the command center for the auditor engine. When you trigger an audit, the plugin securely extracts your design tokens, packages them with your chosen settings, and dispatches them to our edge network infrastructure.
Supported Token Formats
The plugin automatically detects and standardizes your design tokens. Zero manual mapping is required. It currently supports two primary architectures:
1. Figma Native Variables
The plugin automatically reads your local variable collections via the Figma API, resolving colors, numbers (spacing, radii), and string values. It also tracks the associated Light/Dark modes defined in your collections so the auditor can verify specific themes.
2. Tokens Studio (W3C Format)
If you use the popular Tokens Studio plugin, we natively parse the W3C JSON payload attached to your Figma document. This includes full support for resolving mathematical aliases, typography composites, and shadow composites.
Figma Frames vs. Custom Frames
The auditor web browser needs to know what dimensions to render your website at. By default, you can select any top-level frame in your Figma document. The auditor will automatically detect its dimensions (e.g., an iPhone 17 frame at 402x874) and instruct the headless browser to emulate that exact device profile.
Custom Frames: If you are auditing a site but don't have a specific Figma mockup to reference, click the Add Custom Frame button in the plugin. This allows you to manually input a Width and Height (e.g., 1920 x 1080) to force the auditor web browser viewport to a specific dimension.
Using the Dashboard
Once the audit is dispatched, click View Audits directly in the Figma plugin to launch your secure web dashboard. The dashboard instantly processes your raw data to give you a visual, actionable breakdown of any design-to-code discrepancies.
Navigation & Health Metrics
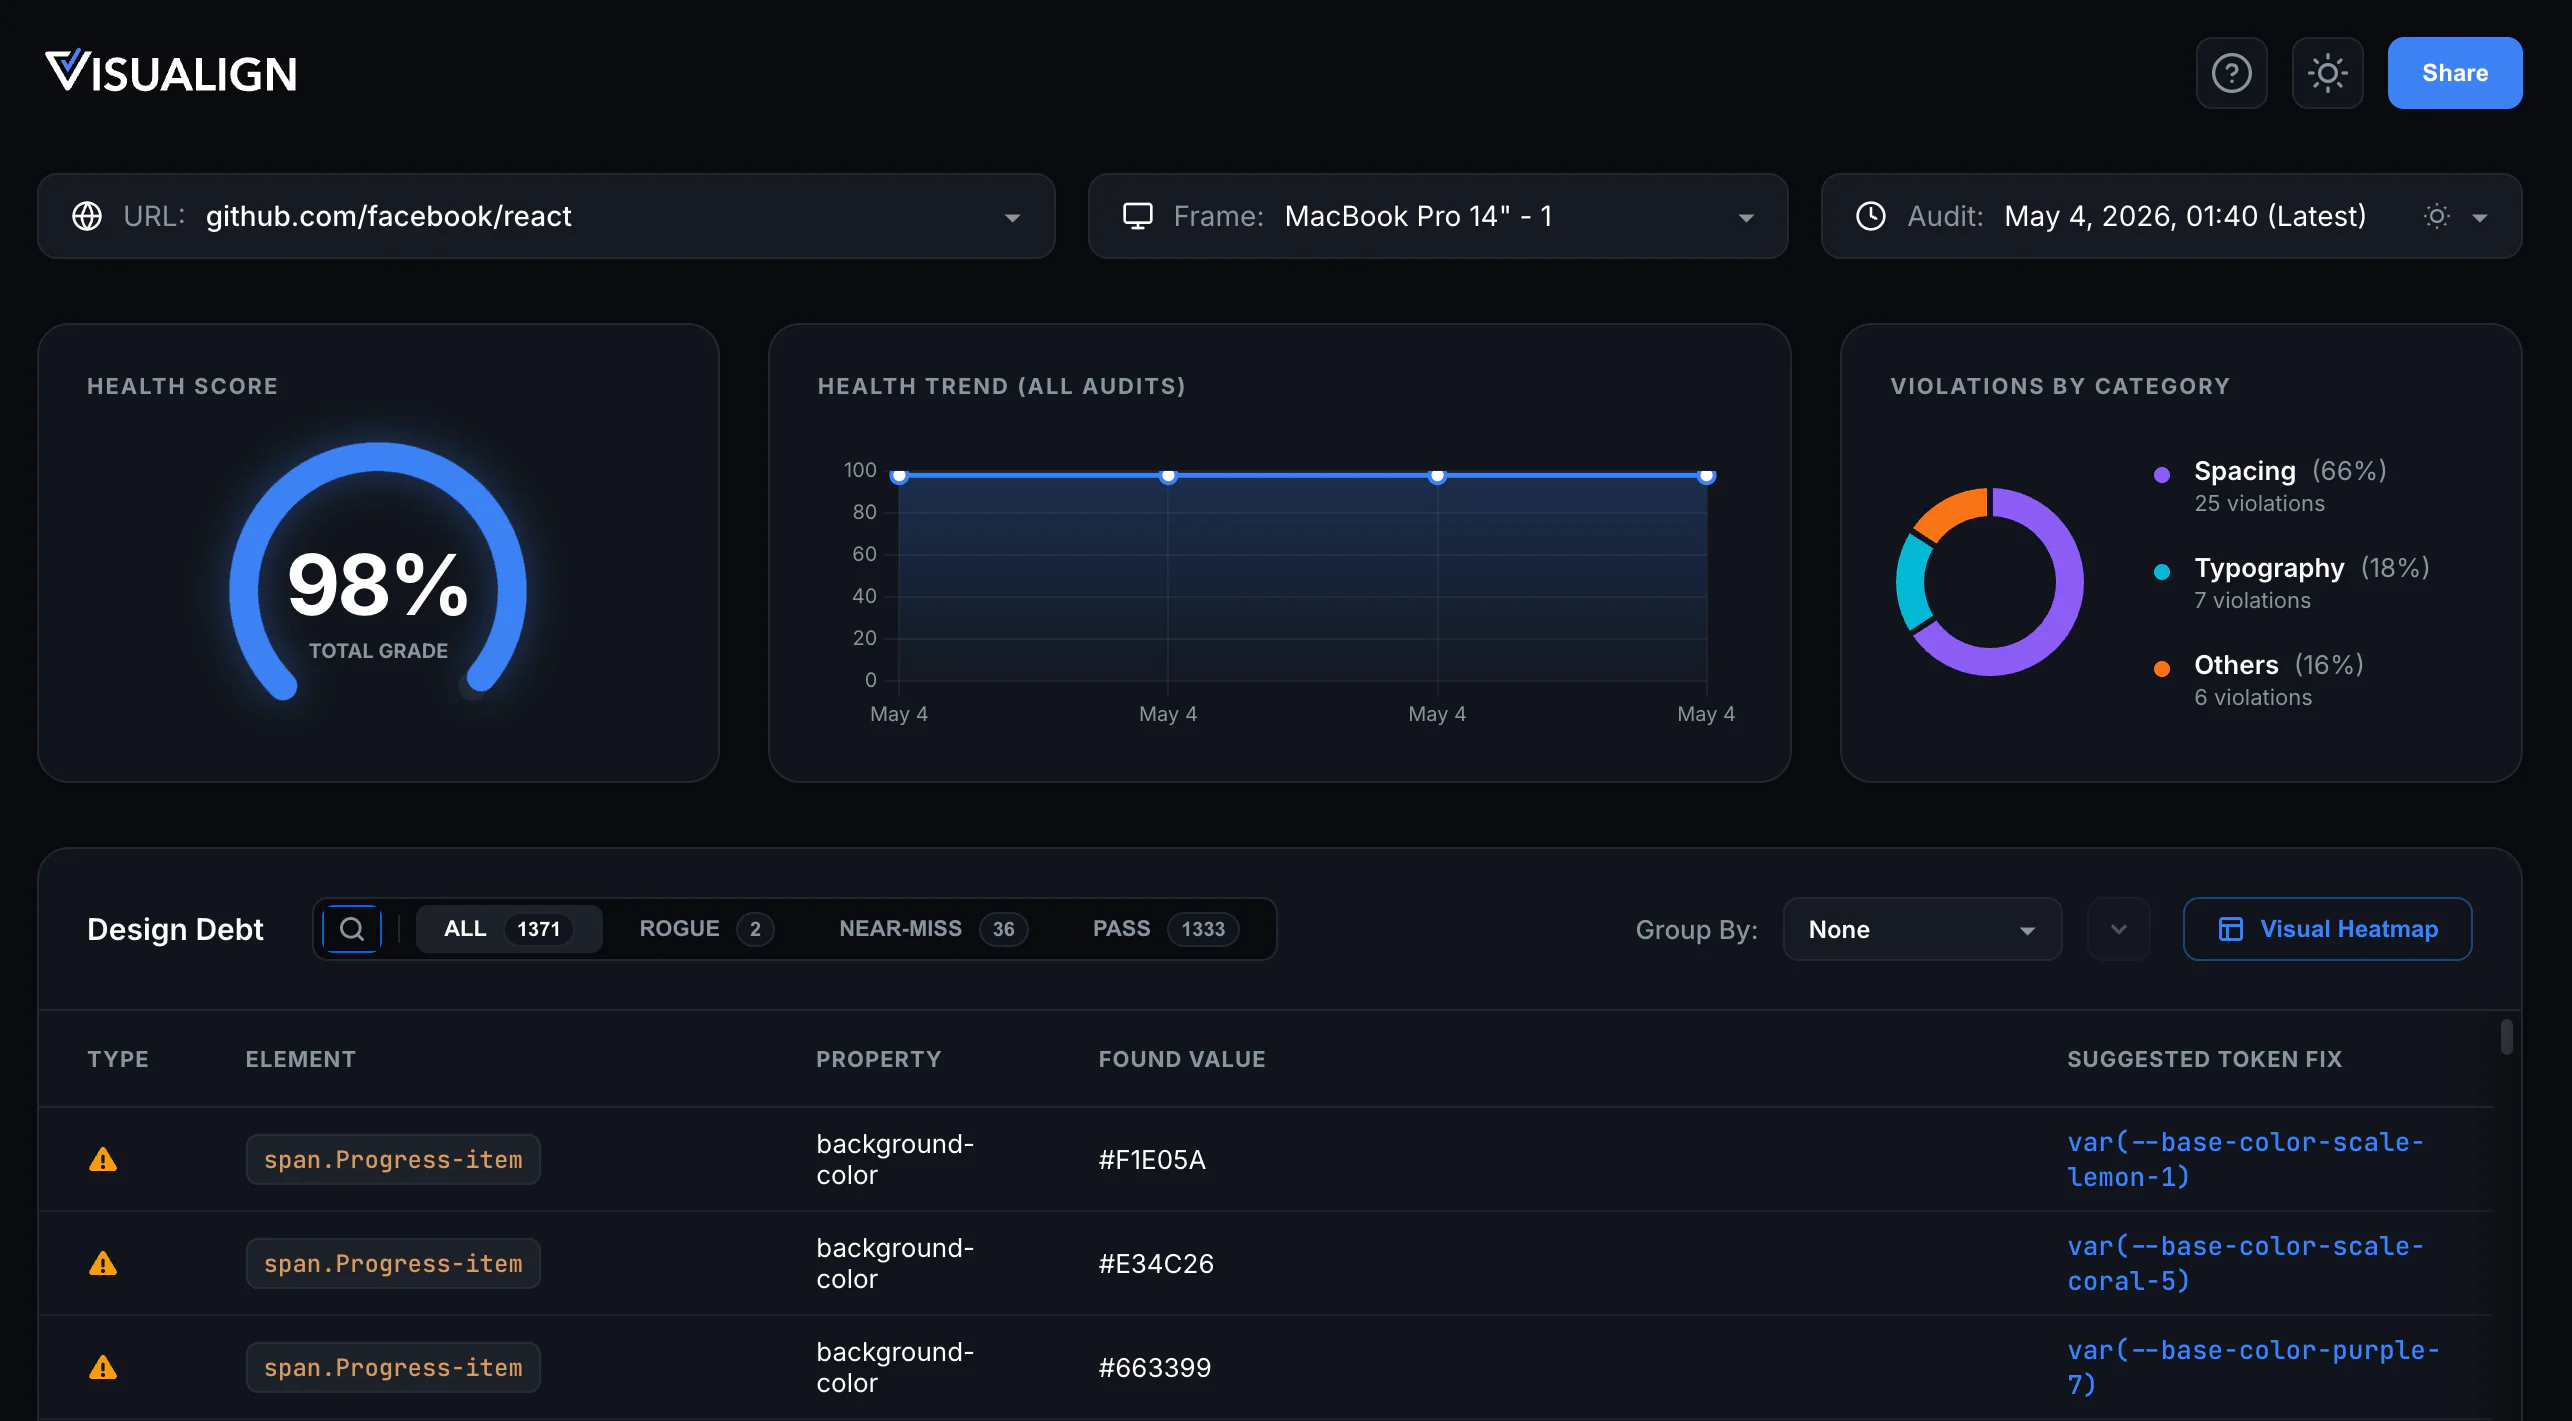
At the top of the dashboard, you will find controls to navigate your data and track your design system's implementation quality over time.
- URL Menu: Switch between different webpages or web apps you have audited.
- Frame Menu: Select the specific viewport or device profile (e.g., Desktop, iPhone) to view results for the current URL.
- Audit History: Browse past audits for the selected URL and Frame combination. This menu displays the exact timestamp and the theme (Light/Dark) used for the run, allowing you to easily compare historical changes.
- Health Score: An aggregate percentage grade representing how closely the computed CSS matches your design tokens. Rogue and Near-Miss values proportionally reduce this score.
- Health Trendline: A visual graph plotting your Health Score across all past audits, making it easy to see if design debt is being resolved or if it is accumulating over time.
Actionable Debt Table
Knowing a value is wrong isn't enough to fix it. Visualign calculates how far the coded value has drifted from the design, and instantly provides the closest matching token from your design system.
- Pass (Green): The computed CSS matches a token perfectly within acceptable browser rendering margins.
- Near-Miss (Yellow): The developer hardcoded a value (e.g.,
#3B82F5) that is mathematically nearly identical to a system token (e.g.,var(--color-blue-500)). The suggested token is provided so they can swap it out. - Rogue (Red): A value was found that has no mathematical equivalent anywhere in your design system. This usually indicates a completely custom, unapproved style that requires manual design review.
Filtering & Grouping
When auditing large pages, you may generate thousands of violations. The dashboard is built to handle massive payloads smoothly.
- Group By: Use the Group By dropdown to cluster violations. Grouping by Category separates Typography from Spacing and Colors. Grouping by Element (e.g.,
button.primary) allows an engineer to fix a single CSS class and resolve dozens of violations simultaneously. - Search: The search bar instantly filters the table. Searching for a specific hex code, class name, or token alias will instantly isolate those rows.
The Visual Heatmap
Click Visual Heatmap to open the interactive drawer. The auditor engine captures a high-fidelity screenshot of the rendered page and plots the design debt directly onto it.
Interactive Dots: Red (Rogue) and Yellow (Near-Miss) dots pulse over the offending DOM nodes. Hovering over a dot will highlight its corresponding row in the data table and display a tooltip with the exact CSS property that failed.
Figma Overlay Mode: If you selected a specific Figma frame (rather than a Custom Frame) when launching the audit, the heatmap drawer will overlay your raw Figma design directly on top of the live screenshot. Use the Split slider or the Opacity slider to swipe back and forth, allowing you to instantly spot subtle layout shifts or margin discrepancies.
How the Health Score is Calculated
We believe in complete transparency. Your Health Score is not an arbitrary grade; it is a strict mathematical calculation based on the total number of audited CSS properties across your page and their exact computed values.
Each audited property is assigned a penalty weight based on its severity:
- Pass (0 penalty): The computed DOM value perfectly matches your design token.
- Near-Miss (0.5 penalty): The value is mathematically close, but hardcoded. This represents manageable design debt.
- Rogue (1.0 penalty): The value has no mathematical equivalent in your system, representing severe design drift.
The Formula:
((Total Checks - (Rogue + (Near-Miss × 0.5))) ÷ Total Checks) × 100 = Health Score %
Auditing Tolerances
Because browser rendering engines interpret CSS slightly differently (sub-pixel anti-aliasing, color space rounding), our engine uses strict mathematical tolerances to prevent false positives:
- Colors: Evaluated using the DeltaE visual distance metric. A DeltaE difference ≤ 2.0 is considered a perfect Pass, while ≤ 15.0 triggers a Near-Miss.
- Spacing & Sizing: Padding, margins, and gaps must be an exact match to Pass, but allow up to a 2px difference to trigger a Near-Miss.
- Typography: Font sizes allow a 1px tolerance for Near-Misses, while Font Weights allow a 100-point difference (e.g., hardcoding
500instead of using a `semibold` token). - Strict Matches: Properties like
z-indexrequire an absolute, 0-tolerance mathematical match.
Advanced Guides
Authentication (Private Sites)
Available on Pro and Business plans. If your target app or staging environment is protected by a login screen, toggle Authentication Required in the plugin.
Provide test credentials (username and password). Our heuristic engine will automatically locate the login inputs, bypass the gate, and audit the protected routes behind the login. We do not store these credentials; they are held in memory just long enough to authenticate and are destroyed immediately.
Link Harvesting (Bulk Auditing)
Available on Pro and Business plans. Toggle Audit linked subpages in the plugin before running.
The auditor will securely load the target URL, discover all internal links belonging to the same origin, and concurrently dispatch background workers to audit those subpages using the exact same device profile and theme. This is the fastest way to audit an entire component library or documentation site in seconds.
Auditing Localhost Sites
Because the auditor engine runs securely on Cloudflare's global edge network, it cannot directly access URLs like http://localhost:3000 running on your private machine.
To audit a local development server, you must temporarily expose it via a secure tunnel. We recommend using one of the following free tools:
- VS Code Port Forwarding: If you use VS Code, open the "Ports" tab in the terminal panel, click "Forward a Port", and enter your local port (e.g., 3000). Change the visibility to "Public" and copy the provided URL.
- Ngrok: Run
ngrok http 3000in your terminal. Ngrok will provide a public URL (e.g.,https://1234-abcd.ngrok-free.app). - Localtunnel: Run
npx localtunnel --port 3000in your terminal.
Paste the generated public URL into the Figma plugin to run your audit.
Troubleshooting & Edge Cases
Why are dots missing from the heatmap?
To preserve visual accuracy, the auditor captures a fixed-viewport screenshot (e.g., 1440x900) rather than a full-page scrolling screenshot. If a violation occurs on an element far down the page (below the fold), the dot will not be drawn on the heatmap because it exists outside the boundaries of the image. However, the violation will still be recorded and visible in the Actionable Debt Table.
Why are my web fonts failing the audit?
If your Figma tokens specify a custom font (e.g., `Circular Std`), but the developer has not actually loaded that font file on the target website, the browser will fall back to a system font. The auditor reads computed browser values, so it will flag this as a font mismatch. Ensure your target site is properly loading all required font assets.
Does the auditor support Canvas or WebGL?
No. The auditor evaluates the DOM (Document Object Model) and computed CSS styles. Elements rendered inside a <canvas> tag (like WebGL games or Three.js scenes) do not expose their internal styling to the DOM and cannot be audited.
Frequently Asked Questions
Does it support Dark Mode?
Yes. The auditor automatically detects the native theme associated with your Figma frame by reading the explicit variable modes. You can also manually override this in the plugin settings (Pro/Business feature) to force the auditor web browser viewport to emulate a prefers-color-scheme: dark profile.
How does it handle CSS animations?
The auditor evaluates motion tokens by extracting computed transition-duration and transition-timing-function CSS properties to ensure your developers are using your system's standardized motion curves (e.g., var(--motion-fast)).
Can I share an audit with my developers?
Yes. In the dashboard, click the Share button in the top right. It generates a secure, read-only link containing the visual heatmap and the data table that you can paste directly into Jira, Linear, or Slack.
Why are some of my complex Figma tokens not being audited?
While Visualign fully supports Figma Native Variables (colors, numbers, strings) and Figma Styles (text, effects), Figma's native architecture does not currently support complex nested mathematical aliases or deep responsive breakpoints in the same way the Tokens Studio (W3C) format does. If you are using highly advanced cross-file token math, we recommend using the Tokens Studio plugin, which our engine parses perfectly.
I just ran an audit, but it's not showing up on the dashboard yet. Where is it?
Visualign operates on an asynchronous edge-queue architecture. When you trigger an audit, it is dispatched to background workers that spin up headless browsers to render your site. Depending on the size of the target webpage, network speeds, and if you are using the bulk subpage auditor, it may take anywhere from a few seconds to a minute for the completed audit to process and appear in your dashboard history.
The auditor is failing to log into my staging environment. Why?
Our heuristic authentication engine is designed to intelligently locate standard email/username and password fields to bypass simple staging gates. However, it does not currently support Multi-Factor Authentication (MFA), CAPTCHA challenges, or highly complex Single Sign-On (SSO) redirect loops. If your staging environment uses these, you will need to whitelist our Cloudflare worker IP ranges or temporarily disable MFA for your testing account.
Can the auditor check hover states or interactive dropdowns?
Not currently. The auditor engine waits for the network to idle and then analyzes the initial computed DOM state upon page load. Elements that require active user interaction (like hovering a button, expanding an accordion, or clicking a dropdown menu) to render on the screen are not currently captured in the automated CSS extraction.
Why did my custom Figma frame render as a Desktop browser?
When you select a native Figma frame (e.g., named "iPhone 14 Pro"), the engine reads that name and automatically configures the headless browser's User-Agent, touch events, and pixel density to perfectly emulate that specific device. If you use the "Custom Frame" option and input manual dimensions without a device name, the engine defaults to a standard Desktop Chrome profile.
Security & Privacy Policy
We operate on a strict principle of Ephemeral Storage. We do not permanently store your proprietary code, design tokens, or authentication credentials.
Data Retention & Cloudflare KV
All data generated by an audit (screenshots, visual heatmaps, and JSON payloads) is stored securely on Cloudflare's edge KV network and is strictly bound by an automated Time-To-Live (TTL) expiration. Once the TTL expires, the data is permanently wiped from the servers.
- Free Tier: Data is permanently wiped after 7 days to match the token lifecycle.
- Pro & Lifetime Tiers: Data is permanently wiped after 90 days.
- Business: Data is permanently wiped after 180 days.
Infrastructure Security
The auditing engine runs on isolated, ephemeral Cloudflare infrastructure. The headless browser instances are destroyed immediately after the audit completes. If you provide login credentials for staging authentication, they are never written to disk or saved to our database.
No Source Code Scraping
The auditor does not download or store your React, Vue, or HTML source files. It only extracts computed CSS values directly from the browser's rendering engine.